




Mycotoxin contamination is neither uniform nor static. It varies among countries, growing seasons, crops, and weather conditions, making access to updated regional data essential for effective risk management. To help feed professionals, nutritionists, veterinarians, and animal producers better understand this changing threat, Mycotoxinsite has launched a new interactive global map showing the levels of major mycotoxins detected in periodic corn surveys worldwide. By combining contamination data with species-specific risk levels, the map is designed to support faster, better-informed decisions throughout the feed and livestock production chain. Available in English and Spanish, this new tool transforms analytical results into an accessible visual resource that allows users to explore mycotoxin occurrence by year and country.
MYCOTOXINS: AN INVISIBLE CHALLENGE WITH VISIBLE CONSEQUENCES Mycotoxins are toxic secondary metabolites produced by certain species of fungi, particularly those belonging to the Aspergillus, Fusarium and Penicillium. They can contaminate crops in the field, during harvest, or throughout storage and feed processing. Corn is especially vulnerable because it can be affected by several mycotoxigenic fungi under a wide range of environmental conditions. As a result, it may contain multiple mycotoxins—sometimes simultaneously.
Unlike visible mold growth, mycotoxins cannot usually be detected through a simple visual inspection. Furthermore, the absence of visible mold does not guarantee that a raw material is free from contamination. Mycotoxin effects on animals depend on several factors, including: Exposure to mycotoxins can lead to a gradual and sometimes difficult-to-identify deterioration in performance, and may also reduce resilience to infectious and environmental challenges, contributing to inconsistent results even when diets appear nutritionally adequate. For this reason, an analytical result becomes much more meaningful when it is interpreted in relation to the animal that will consume the feed.
 Type and concentration of the mycotoxinDuration of exposureAnimal speciesAgePhysiological statusHealth conditionPresence of other contaminants
 Species susceptibility is also highly variable.
A GLOBAL VIEW WITH COUNTRY-LEVEL DETAIL The new Mycotoxinsite map provides an immediate overview of the mycotoxin situation detected in corn samples from different parts of the world. Users can filter the available information by year and country, allowing them to compare geographical areas and observe how contamination patterns evolve over time as new surveys are incorporated.
Countries for which data are available are highlighted on the global map. By clicking on a country, users can access a detailed table containing key indicators for the principal mycotoxins detected, including: The distinction between these indicators is important.
 Average concentrationMaximum concentrationMedian concentrationMinimum concentrationPrevalence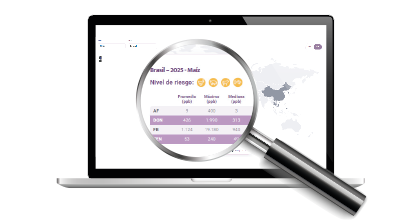
Together, these values provide a more complete interpretation than any single figure considered in isolation. The map also displays the estimated risk level for major animal-production species: A clear color-coded system classifies the situation aslow, moderate, high or critical risk. This makes complex analytical information easier to interpret and highlights an essential principle of mycotoxin management: the same contaminated ingredient may not represent the same risk for every animal. By bringing together geographical visualization, periodic corn-survey results, detailed contamination statistics, and speciesspecific risk interpretation, the new Mycotoxinsite global map helps close the gap between analytical data and practical action.
 Poultry
 Swine
Swine Ruminants
 Aquaculture species
WHY PERIODIC SURVEILLANCE MATTERS A mycotoxin survey is a snapshot of a specific crop, region, and period.
It does not replace the analysis of individual raw materials or finished feeds, but it provides valuable context for:
 Designing sampling plansPrioritizing analytical resourcesEvaluating suppliersDetermining where closer monitoring may be necessary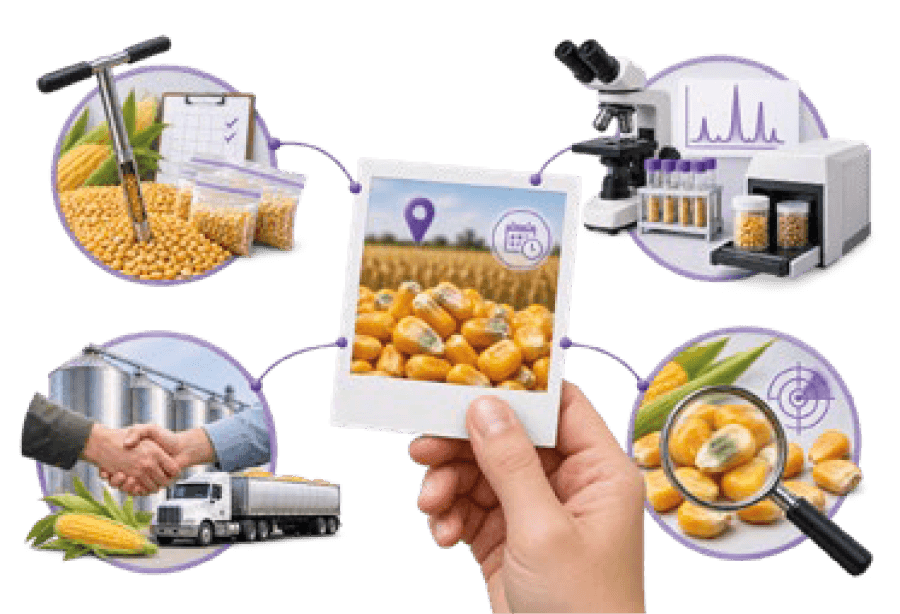
Regular updates will therefore allow the tool to develop into a historical resource, revealing emerging trends rather than presenting contamination as a fixed characteristic of a country. Product selection, however, should always respond to the mycotoxins detected and the characteristics of the exposed animals. There is no universal solution independent of diagnosis.
 Micotoxicosis prevention